Insights
Application metrics
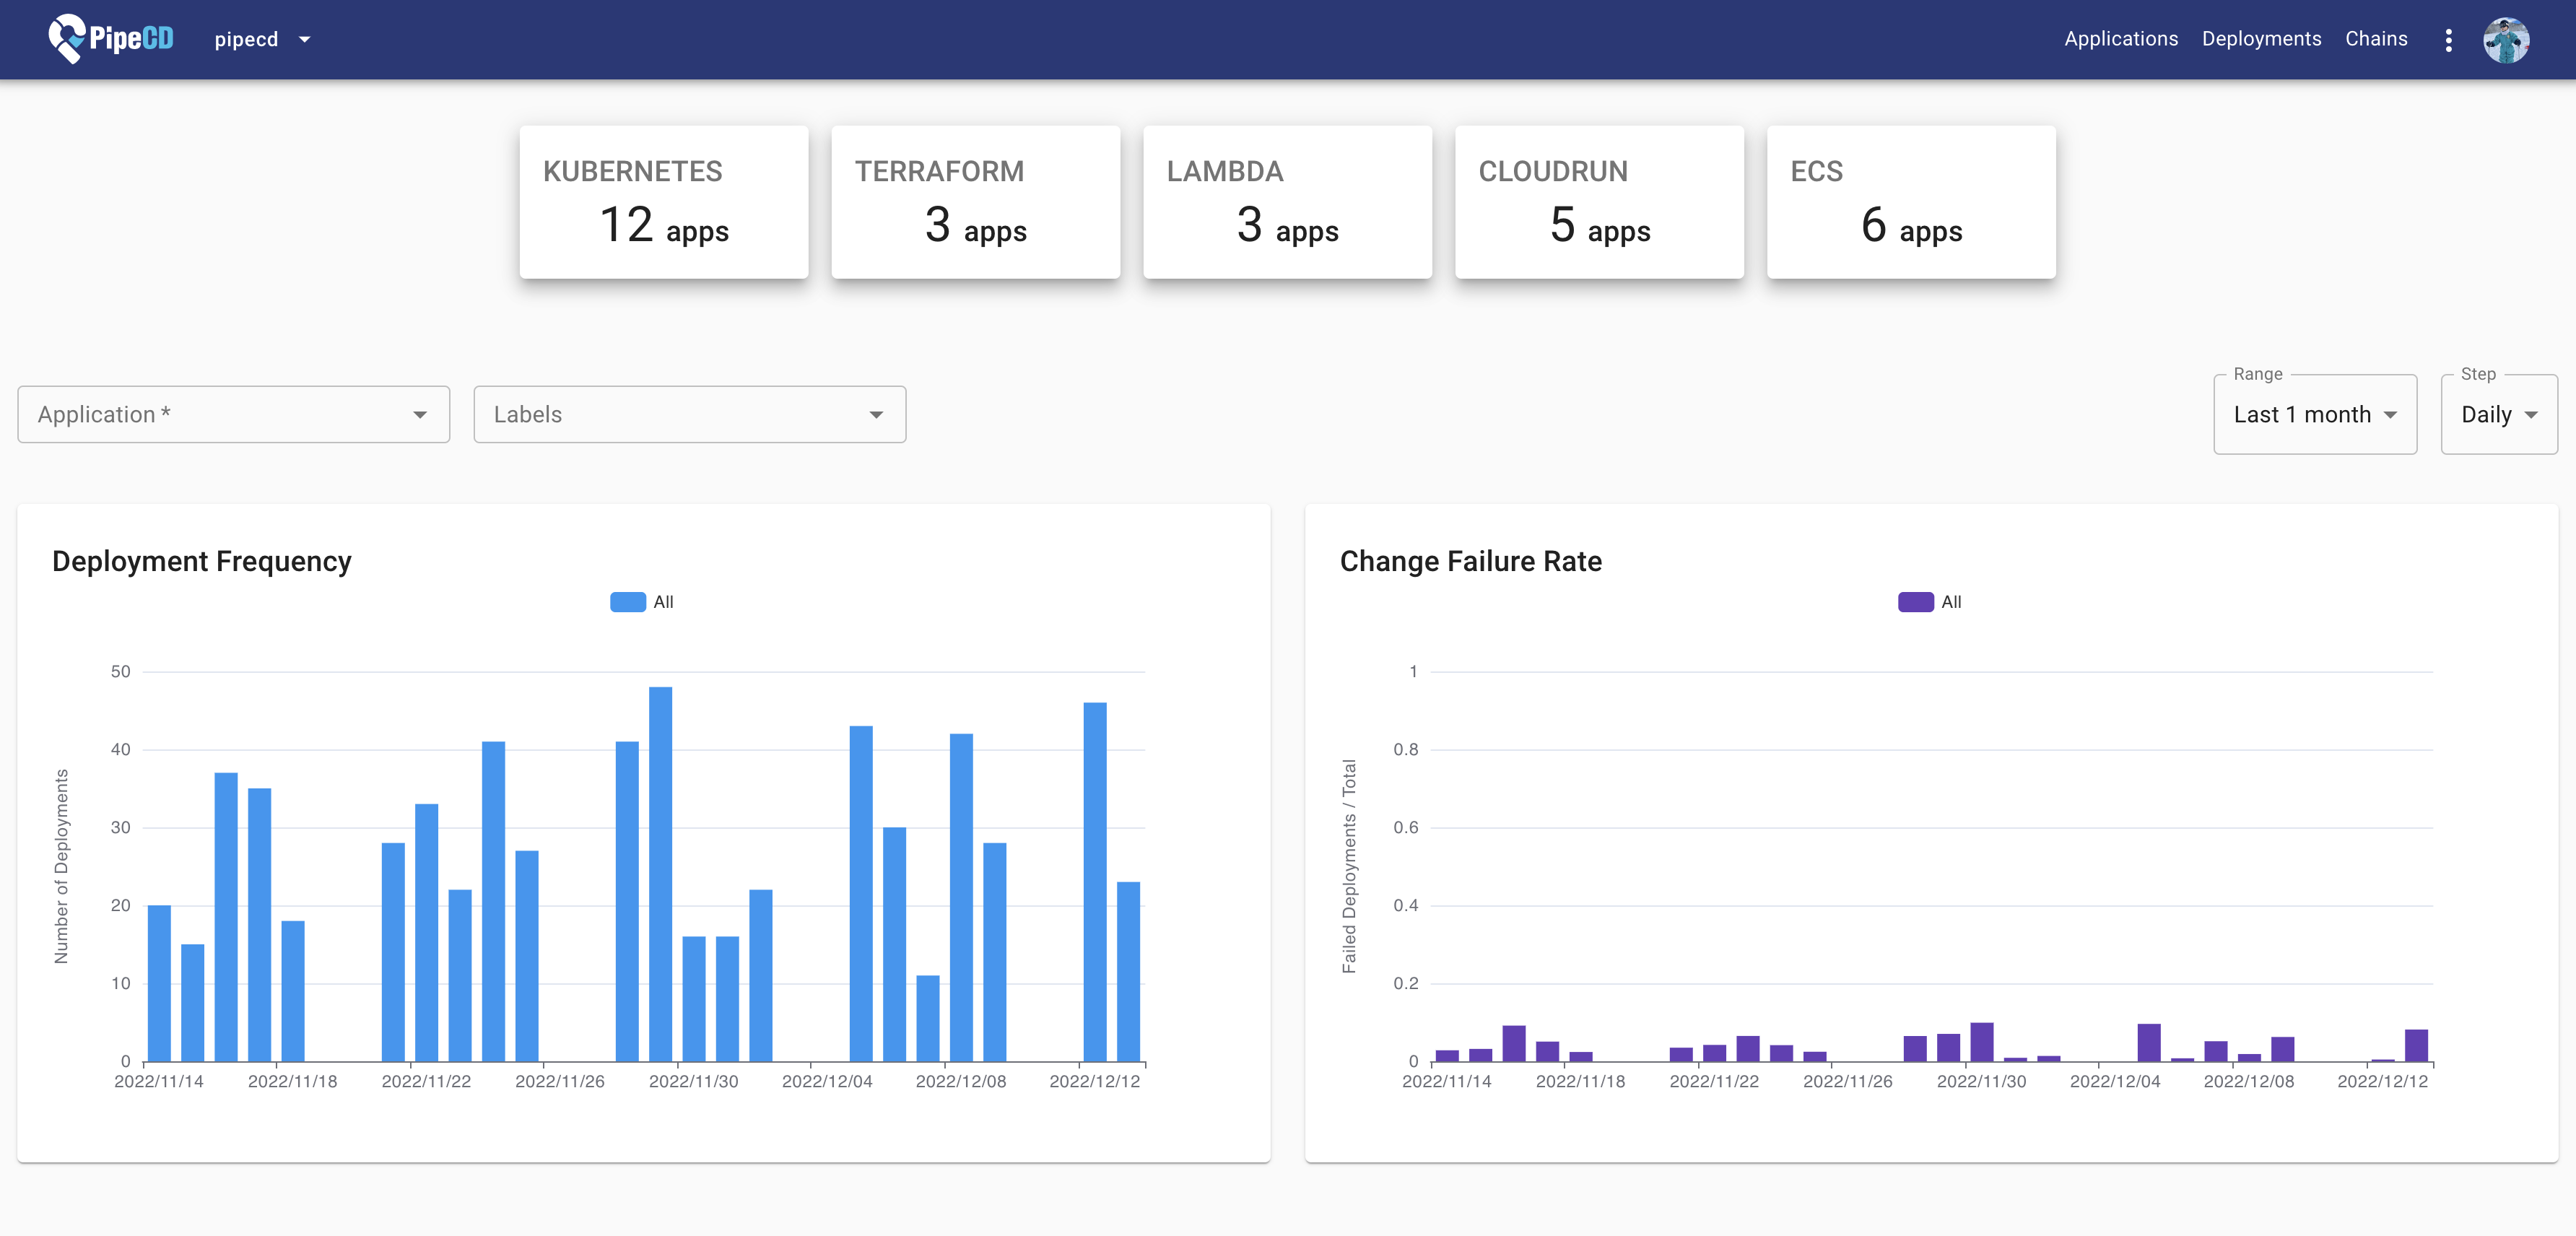
The topmost block helps you understand how many applications your project has.
Deployment metrics
Based on your executed deployment data, PipeCD provides charts that help you better understand the delivery performance of your organization.
You can view daily, and monthly data visualizations of your entire project, a specific application, or a group of applications that match a list of labels.
Deployment Frequency
How often does your application/project deploy code to production.
Change Failure Rate
How often deployment failures occur in production that requires an immediate remedy (fix, rollback…).
Lead Time for Changes
How long does it take to go from code committed to code successfully running on production.
WIP
Mean Time To Restore
How long does it generally take to restore service when a service incident occurs.
WIP
Feedback
Was this page helpful?
Glad to hear it! Please tell us how we can improve.
Sorry to hear that. Please tell us how we can improve.