Metrics
PipeCD comes with a monitoring system including Prometheus, Alertmanager, and Grafana. This page walks you through how to set up and use them.
Monitoring overview
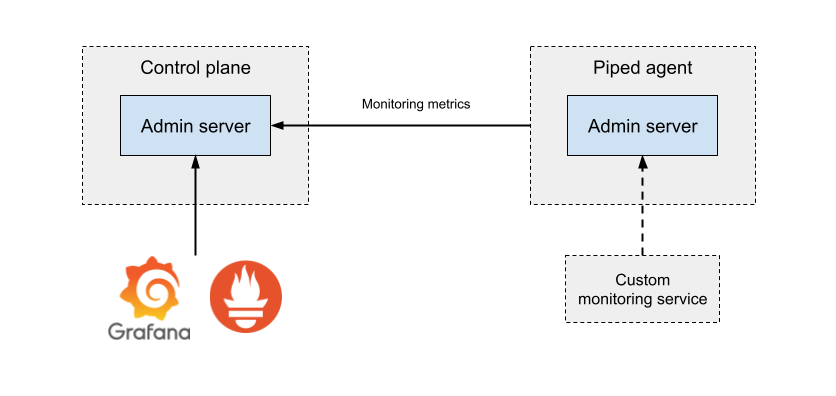
Monitoring Architecture
Both the Control plane and piped agent have their own “admin servers” (the default port number is 9085), which are simple HTTP servers providing operational information such as health status, running version, go profile, and monitoring metrics.
The piped agent collects its metrics and periodically sends them to the Control plane. The Control plane then compacts its resource usage and cluster information with the metrics sent by the piped agent and re-publishes them via its admin server. When the PipeCD monitoring feature is turned on, Prometheus, Alertmanager, and Grafana are deployed with the Control plane, and Prometheus retrieves metrics information from the Control plane’s admin server.
Developers managing the piped agent can also get metrics directly from the piped agent and monitor them with their custom monitoring service.
Enable monitoring system
To enable monitoring system for PipeCD, you first need to set the following value to helm install when installing.
--set monitoring.enabled=true
Dashboards
If you’ve already enabled monitoring system in the previous section, you can access Grafana using port forwarding:
kubectl port-forward -n {NAMESPACE} svc/{PIPECD_RELEASE_NAME}-grafana 3000:80
Control Plane dashboards
There are three dashboards related to Control Plane:
- Overview - usage stats of PipeCD
- Incoming Requests - gRPC and HTTP requests stats to check for any negative impact on users
- Go - processes stats of PipeCD components
Piped dashboards
Visualize the metrics of Piped registered in the Control plane.
- Overview - usage stats of piped agents
- Process - resource usage of piped agent
- Go - processes stats of piped agents.
Cluster dashboards
Because cluster dashboards tracks cluster-wide metrics, defaults to disable. You can enable it with:
--monitoring.clusterStats=true
There are three dashboards that track metrics for:
- Node - nodes stats within the Kubernetes cluster where PipeCD runs on
- Pod - stats for pods that make PipeCD up
- Prometheus - stats for Prometheus itself
Alert notifications
If you want to send alert notifications to external services like Slack, you need to set an alertmanager configuration file.
For example, let’s say you use Slack as a receiver. Create values.yaml and put the following configuration to there.
prometheus:
  alertmanagerFiles:
    alertmanager.yml:
      global:
        slack_api_url: {YOUR_WEBHOOK_URL}
      route:
        receiver: slack-notifications
      receivers:
        - name: slack-notifications
          slack_configs:
            - channel: '#your-channel'
And give it to the helm install command when installing.
--values=values.yaml
See here for more details on AlertManager’s configuration.
Feedback
Was this page helpful?
Glad to hear it! Please tell us how we can improve.
Sorry to hear that. Please tell us how we can improve.