Adding an automated deployment analysis stage
NOTE: This feature is currently alpha status.
Automated Deployment Analysis (ADA) evaluates the impact of the deployment you are in the middle of by analyzing the metrics data, log entries, and the responses of the configured HTTP requests. The analysis of the newly deployed application is often carried out in a manual, ad-hoc or statistically incorrect manner. ADA automates that and helps to build a robust deployment process. ADA is available as a stage in the pipeline specified in the application configuration file.
ADA does the analysis by periodically performing queries against the Analysis Provider and evaluating the results to know the impact of the deployment. Then based on these evaluating results, the deployment can be rolled back immediately to minimize any negative impacts.
The canonical use case for this stage is to determine if your canary deployment should proceed.
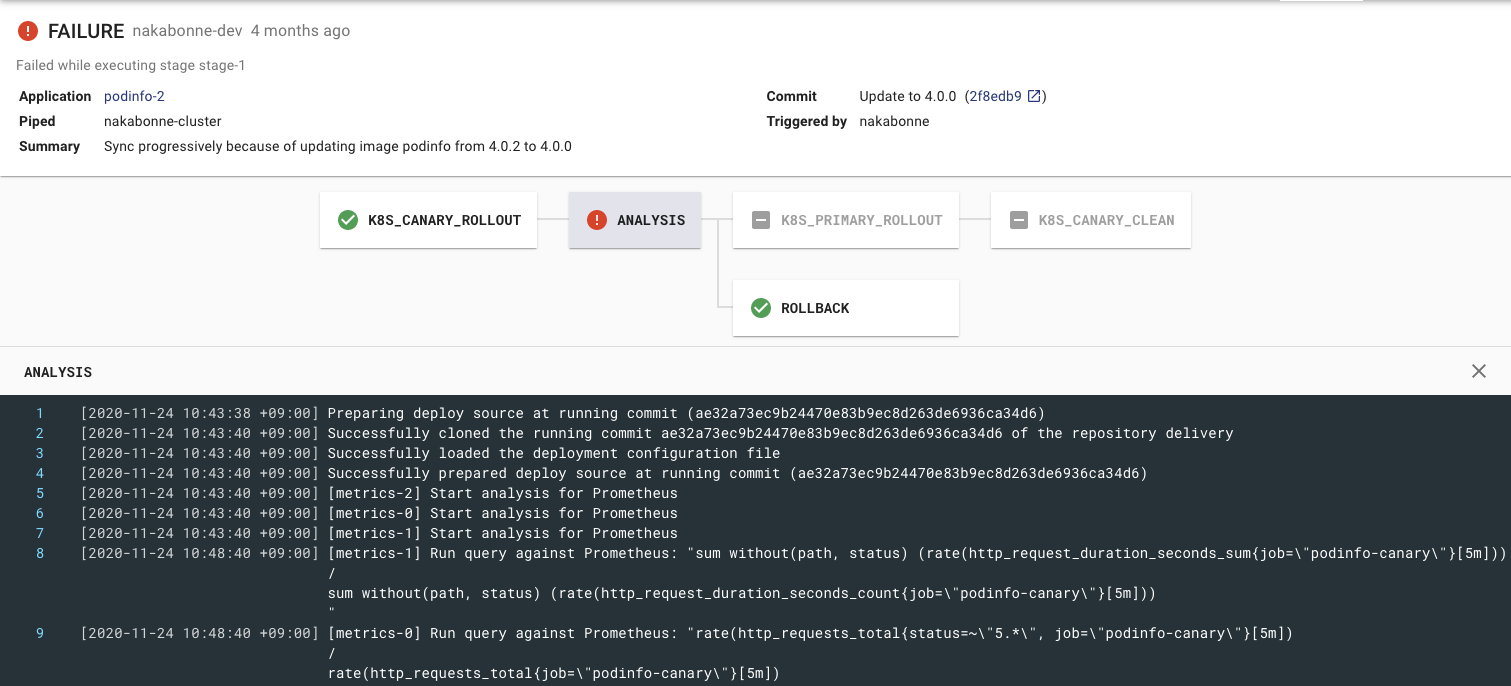
Automatic rollback based on the analysis result
Prerequisites
Before enabling ADA inside the pipeline, all required Analysis Providers must be configured in the Piped Configuration according to this guide.
Analysis by metrics
Strategies
You can choose one of the four strategies to fit your use case.
THRESHOLD: A simple method to compare against a statically defined threshold (same as the typical analysis method up tov0.18.0).PREVIOUS: A method to compare metrics with the last successful deployment.CANARY_BASELINE: A method to compare the metrics between the Canary and Baseline variants.CANARY_PRIMARY(not recommended): A method to compare the metrics between the Canary and Primary variants.
THRESHOLD is the simplest strategy, so it’s for you if you attempt to evaluate this feature.
THRESHOLD only checks if the query result falls within the statically specified range, whereas others evaluate by checking the deviation of two time-series data.
Therefore, those configuration fields are slightly different from each other. The next section covers how to configure the ADA stage for each strategy.
Configuration
Here is an example for the THRESHOLD strategy.
apiVersion: pipecd.dev/v1beta1
kind: KubernetesApp
spec:
  pipeline:
    stages:
      - name: ANALYSIS
        with:
          duration: 30m
          metrics:
            - strategy: THRESHOLD
              provider: my-prometheus
              interval: 5m
              expected:
                max: 0.01
              query: |
                sum (rate(http_requests_total{status=~"5.*"}[5m]))
                /
                sum (rate(http_requests_total[5m]))
In the provider field, put the name of the provider in Piped configuration prepared in the Prerequisites section.
The ANALYSIS stage will continue to run for the period specified in the duration field.
In the meantime, Piped sends the given query to the Analysis Provider at each specified interval.
For each query, it checks if the result is within the expected range. If it’s not expected, this ANALYSIS stage will fail (typically the rollback stage will be started).
You can change the acceptable number of failures by setting the failureLimit field.
The other strategies are basically the same, but there are slight differences. Let’s take a look at them.
PREVIOUS strategy
In the PREVIOUS strategy, Piped queries the analysis provider with the time range when the deployment was previously successful, and compares that metrics with the current metrics.
apiVersion: pipecd.dev/v1beta1
kind: KubernetesApp
spec:
  pipeline:
    stages:
      - name: ANALYSIS
        with:
          duration: 30m
          metrics:
            - strategy: PREVIOUS
              provider: my-prometheus
              deviation: HIGH
              interval: 5m
              query: |
                sum (rate(http_requests_total{status=~"5.*"}[5m]))
                /
                sum (rate(http_requests_total[5m]))
In the THRESHOLD strategy, we used expected to evaluate the deployment, but here we use deviation instead.
The stage fails on deviation in the specified direction. In the above example, it fails if the current metrics is higher than the previous.
CANARY strategy
With baseline:
In the CANARY_BASELINE strategy, Piped checks if there is a significant difference between the metrics of the two running variants, Canary and Baseline.
apiVersion: pipecd.dev/v1beta1
kind: KubernetesApp
spec:
  pipeline:
    stages:
      - name: ANALYSIS
        with:
          duration: 30m
          metrics:
            - strategy: CANARY_BASELINE
              provider: my-prometheus
              deviation: HIGH
              interval: 5m
              query: |
                sum (rate(http_requests_total{job="foo-{{ .Variant.Name }}", status=~"5.*"}[5m]))
                /
                sum (rate(http_requests_total{job="foo-{{ .Variant.Name }}"}[5m]))
Like PREVIOUS, you specify the conditions for failure with deviation.
It generates different queries for Canary and Baseline to compare the metrics. You can use the Variant args to template the queries. Analysis Template uses the Go templating engine which only replaces values. This allows variant-specific data to be embedded in the query.
The available built-in args currently are:
| Property | Type | Description |
|---|---|---|
| Variant.Name | string | “canary”, “baseline”, or “primary” will be populated |
Also, you can define the custom args using baselineArgs and canaryArgs, and refer them like {{ .VariantCustom.Args.job }}.
          metrics:
            - strategy: CANARY_BASELINE
              provider: my-prometheus
              deviation: HIGH
              baselineArgs:
                job: bar
              canaryArgs:
                job: baz
              interval: 5m
              query: cpu_usage{job="{{ .VariantCustomArgs.job }}", status=~"5.*"}
With primary (not recommended):
If for some reason you cannot provide the Baseline variant, you can also compare Canary and Primary. However, we recommend that you compare it with Baseline that is a variant launched at the same time as Canary as much as possible.
Comparison algorithm
The metric comparison algorithm in PipeCD uses a nonparametric statistical test called Mann-Whitney U test to check for a significant difference between two metrics collection (like Canary and Baseline, or the previous deployment and the current metrics).
Example pipelines
Analyze the canary variant using the THRESHOLD strategy:
apiVersion: pipecd.dev/v1beta1
kind: KubernetesApp
spec:
  pipeline:
    stages:
      - name: K8S_CANARY_ROLLOUT
        with:
          replicas: 20%
      - name: ANALYSIS
        with:
          duration: 30m
          metrics:
            - provider: my-prometheus
              interval: 10m
              expected:
                max: 0.1
              query: rate(cpu_usage_total{app="foo"}[10m])
      - name: K8S_PRIMARY_ROLLOUT
      - name: K8S_CANARY_CLEAN
Analyze the primary variant using the PREVIOUS strategy:
apiVersion: pipecd.dev/v1beta1
kind: KubernetesApp
spec:
  pipeline:
    stages:
      - name: K8S_PRIMARY_ROLLOUT
      - name: ANALYSIS
        with:
          duration: 30m
          metrics:
            - strategy: PREVIOUS
              provider: my-prometheus
              interval: 5m
              deviation: HIGH
              query: rate(cpu_usage_total{app="foo"}[5m])
Analyze the canary variant using the CANARY_BASELINE strategy:
apiVersion: pipecd.dev/v1beta1
kind: KubernetesApp
spec:
  pipeline:
    stages:
      - name: K8S_CANARY_ROLLOUT
        with:
          replicas: 20%
      - name: K8S_BASELINE_ROLLOUT
        with:
          replicas: 20%
      - name: ANALYSIS
        with:
          duration: 30m
          metrics:
            - strategy: CANARY_BASELINE
              provider: my-prometheus
              interval: 10m
              deviation: HIGH
              query: rate(cpu_usage_total{app="foo", variant="{{ .Variant.Name }}"}[10m])
      - name: K8S_PRIMARY_ROLLOUT
      - name: K8S_CANARY_CLEAN
      - name: K8S_BASELINE_CLEAN
The full list of configurable ANALYSIS stage fields are here.
See more the example.
Analysis by logs
TBA
Analysis by http
TBA
[Optional] Analysis Template
Analysis Templating is a feature that allows you to define some shared analysis configurations to be used by multiple applications. These templates must be placed at the .pipe directory at the root of the Git repository. Any application in that Git repository can use to the defined template by specifying the name of the template in the application configuration file.
apiVersion: pipecd.dev/v1beta1
kind: AnalysisTemplate
spec:
  metrics:
    http_error_rate:
      interval: 30m
      provider: my-prometheus
      expected:
        max: 0
      query: |
        sum without(status) (rate(http_requests_total{status=~"5.*", job="{{ .App.Name }}"}[1m]))
        /
        sum without(status) (rate(http_requests_total{job="{{ .App.Name }}"}[1m]))
Once the AnalysisTemplate is defined, you can reference from the application configuration using the template field.
apiVersion: pipecd.dev/v1beta1
kind: KubernetesApp
spec:
  pipeline:
    stages:
      - name: ANALYSIS
        with:
          duration: 30m
          metrics:
            - template:
                name: http_error_rate
Analysis Template uses the Go templating engine which only replaces values. This allows deployment-specific data to be embedded in the analysis template.
The available built-in args are:
| Property | Type | Description |
|---|---|---|
| App.Name | string | Application Name. |
| K8s.Namespace | string | The Kubernetes namespace where manifests will be applied. |
Also, custom args is supported. Custom args placeholders can be defined as {{ .AppCustomArgs.<name> }}.
Of course, it can be used in conjunction with Variant args.
See here for more examples.
And the full list of configurable AnalysisTemplate fields are here.
Feedback
Was this page helpful?
Glad to hear it! Please tell us how we can improve.
Sorry to hear that. Please tell us how we can improve.