Application live state
piped continuously observes the resources of deployed applications running in your cluster.
It reports their current state and health to the control plane, where the information is displayed in real time.
This allows you to quickly understand:
- What resources are currently running
- Whether those resources are healthy
- The overall health of the application
What is monitored
For each application, piped tracks the live state of all related resources and components, including their metadata and health status.
The application live state includes:
-
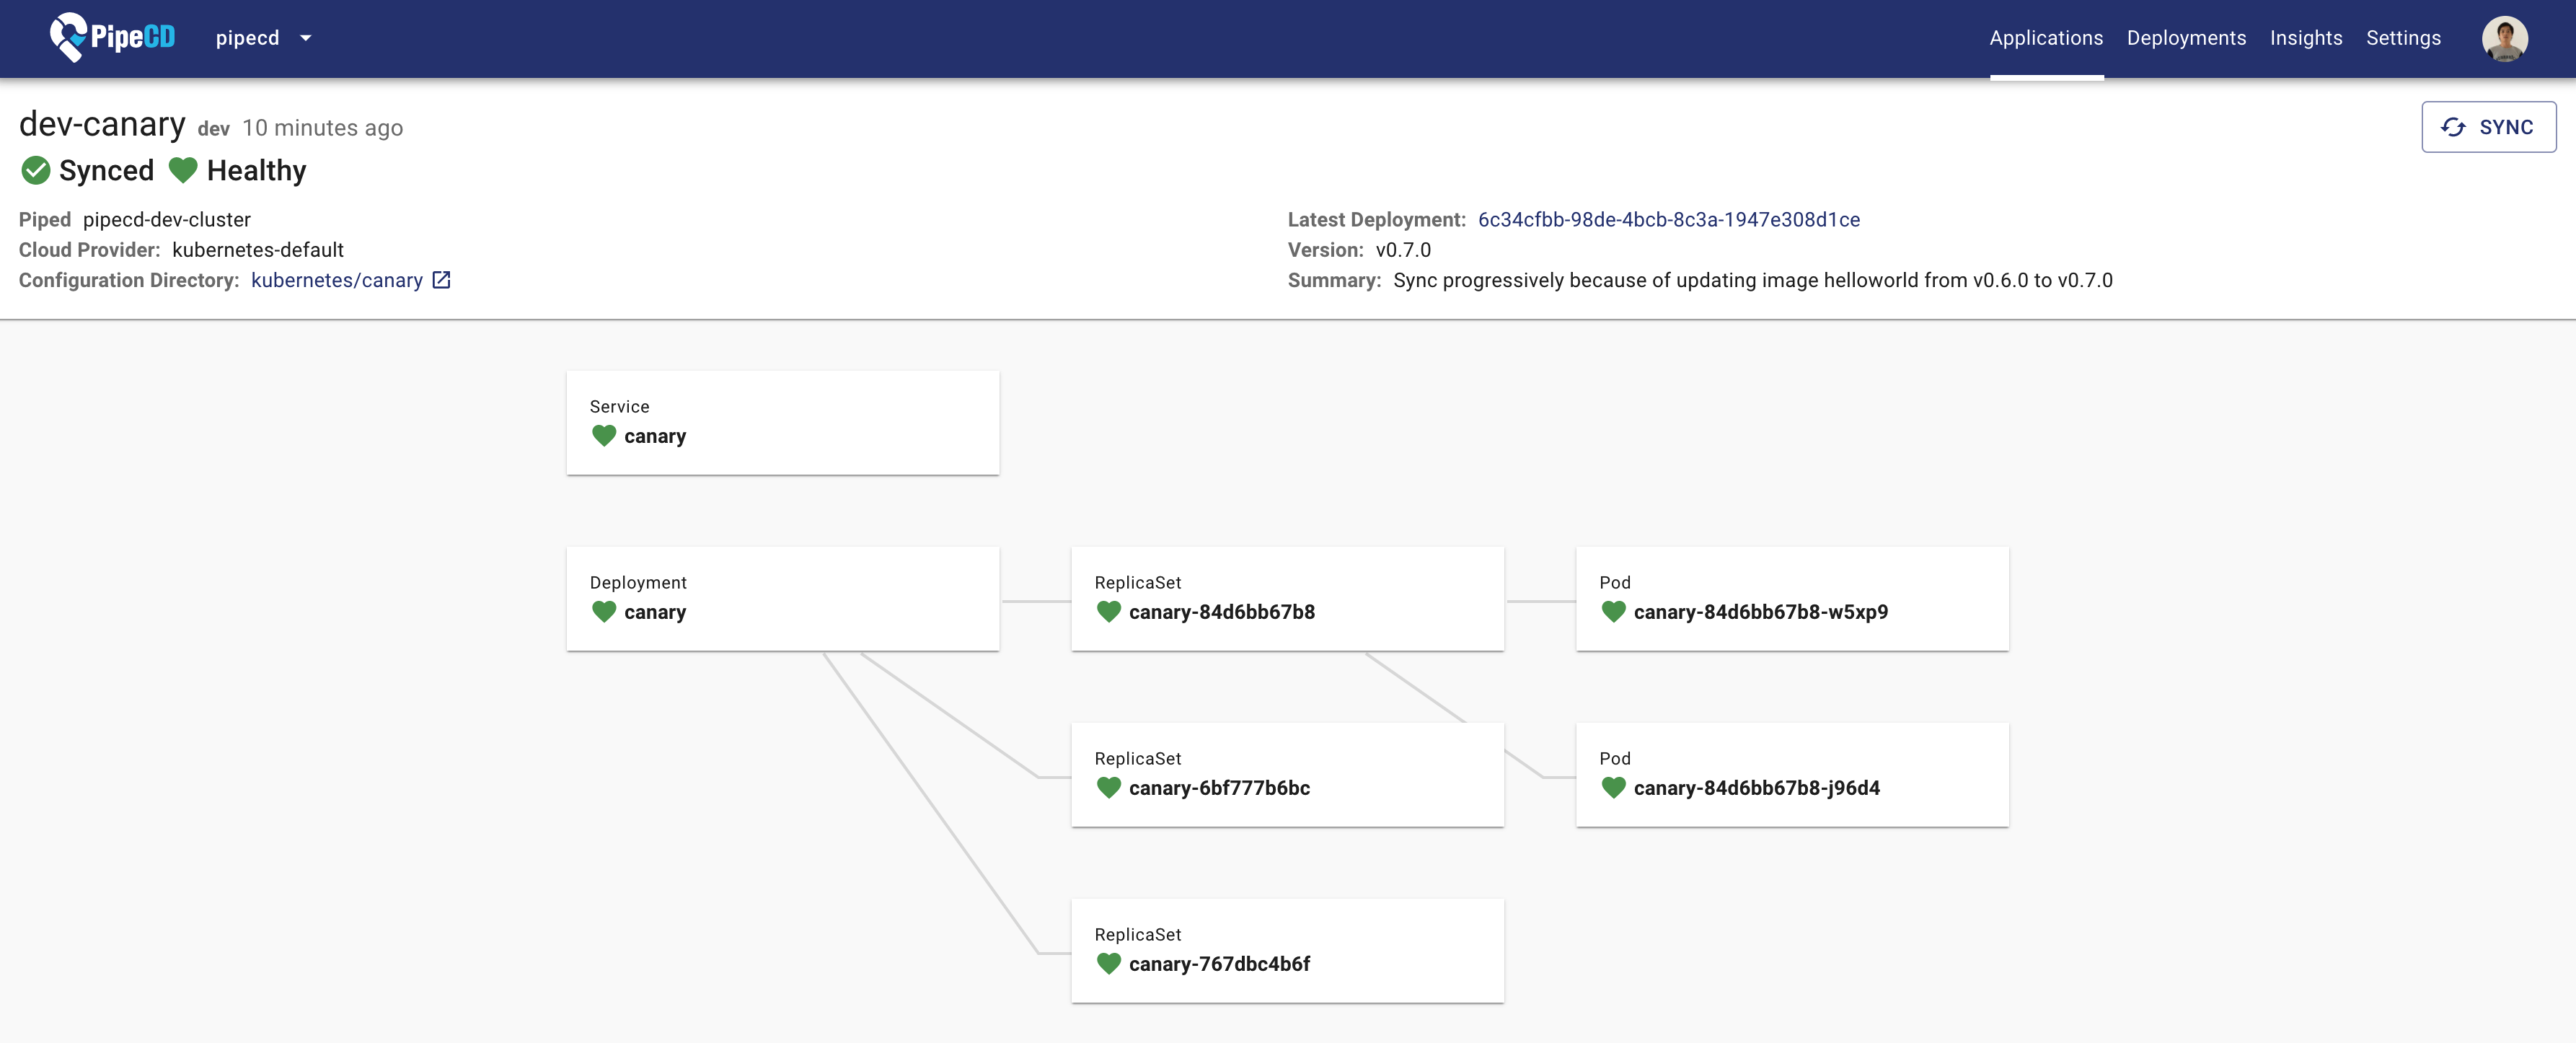
Resource graph: A visual graph showing all application resources and components. Each node represents a resource and displays:
- Resource metadata
- Current health status
-
Application health status: The application is considered
HEALTHYonly when all of its resources and components are markedHEALTHY.
Viewing live state
The live state is shown on the Application Details page in the control plane.
- The graph updates automatically as resource states change.
- This view reflects the actual state of resources in the cluster.
Inspecting a resource
Clicking a resource or component node opens a panel on the right side of the screen.
The panel shows detailed information about the selected resource, helping you investigate its configuration and health further.
Application Details Page
---Feedback
Was this page helpful?
Glad to hear it! Please tell us how we can improve.
Sorry to hear that. Please tell us how we can improve.